
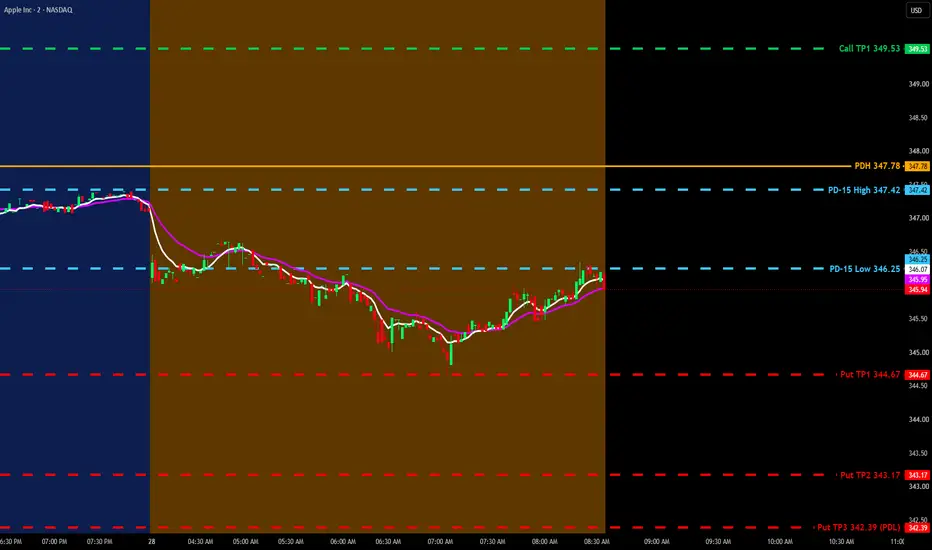
Tech Is Green, AAPL Is Red on Fed Day: Calls or Puts? (Wed 10/28) Chip stocks are rallying, and AAPL is down about half a percent, sitting under my Previous Day 15-minute (PD-15) box. Chip stocks jumped after SK Hynix reported a big profit overnight, but AAPL isn't going with them. There's no clear headline behind it, so I'm not guessing. The Fed announces its interest rate decision at 2 PM, and Apple reports earnings next Monday after the close. In today's video, I covered: - What "the box"
Jelle
@Jelle • 10/28/2026, 02:00 PM
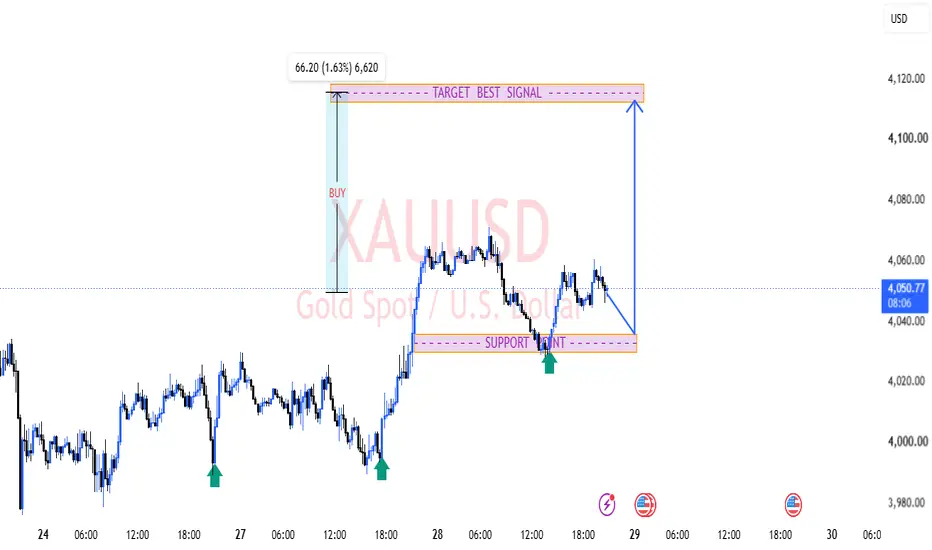
Gold has recently experienced a bullish rally followed by a corrective pullback. Price is now approaching the key demand zone around 4030–4035, where buyers previously demonstrated strong interest. The chart highlights a possible bullish continuation setup, with the expectation that price could rebound from support and move toward the major resistance zone at 4115. Key Bullish Factors: Strong support around 4030–4035. Previous bullish momentum indicates buying interest. Potential higher-low for

$NVDA teetering on the edge today, trading in a tight range as AI rivals flex their muscles. OpenAI shifting to Google's chips? That's gotta sting. Keep an eye on the 200 level, any slip below could spell trouble. Volatility ahead – pack a sandwich and hold on tight.
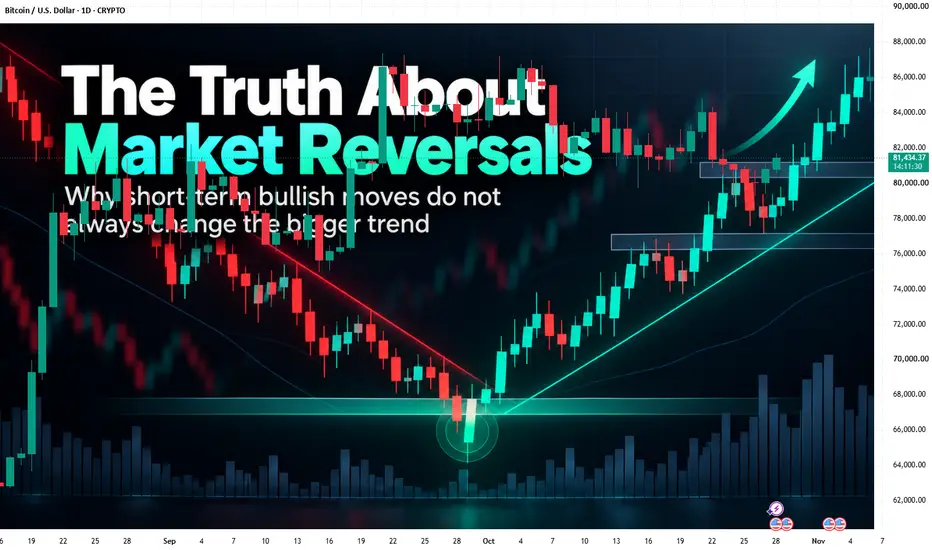
Understanding Why the Same Market Can Show Two Different Trends Imagine checking a trading chart and noticing that prices have started moving upward. Every new peak is slightly higher than the previous one, and buyers seem to be gaining control. At first glance, everything suggests a bullish market. But after switching to a larger timeframe, you discover something unexpected: the overall trend is still moving downward. Does that mean one of the charts is giving you incorrect information? No
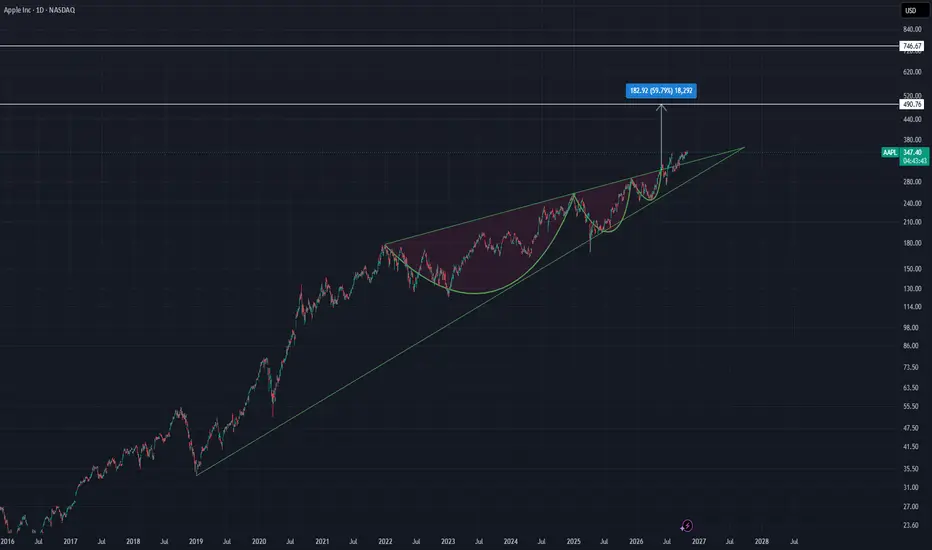
**Apple (AAPL) — Long-Term Bullish Breakout and Potential Continuation Targets** Apple’s logarithmic daily chart displays a long-term **converging rising structure** that has governed price action since 2019. The lower trend line has repeatedly attracted buyers during major corrections, while the upper boundary acted as dynamic resistance. Price has recently broken above this upper boundary and is now consolidating near **$347**, suggesting that the long-term structure may be transitioning from
Jelle
@Jelle • 10/27/2026, 02:00 PM
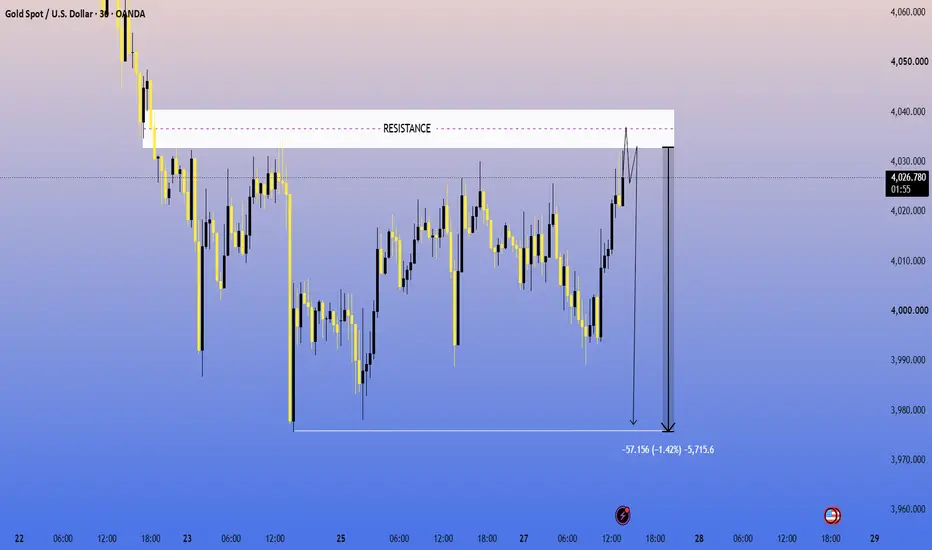
XAU/USD GOLD ANALYSIS — ICT + SMC + PRICE ACTION ⏰ Timeframe: 30M 💰 Current Price: 4025.965 🔴 Market Bias: BEARISH — SELL FROM RESISTANCE 📊 Technical Analysis: Resistance Zone: 4033–4040 Major Support: 3976–3980 Market Structure: Previous bearish momentum; price is recovering toward resistance. ICT/SMC: Potential liquidity grab near resistance, followed by a bearish reaction. Supply Zone: 4033–4040 may attract sellers. Liquidity: Sell-side liquidity may rest below 4000 and around 3976. Price
$NVDA making waves with a massive $3B investment in $META. AI partnerships heating up, but don’t ignore CoreWeave's debt concerns—it's not all sunshine and rainbows. Watch for volatility. If it slips under the 50MA again, could be a wild ride. Stay sharp!